IBM announced on June 25 that it has released a new open source toolkit for developers and data scientists who are trying to find pandemic trends for new colonavirus infections (COVID-19).。This toolkit, which uses "Jupyter Notebook", which is widespread among developers, is aimed at providing dugged analysis.As a result, users can, for example, analyze US counties -level data and identify the correlation between poverty and infection rates.
FREDERICK REISS, the chief architect of IBM Central for Open-Source Data and AI Technologies (Codait), said on the company's blog, "IBM and our team are democratization of technology and the latest datases and tools. We are convinced of the importance of activating the developers' efforts. This is useful for policy proppons to make the best decisions with detailed information to protect the health of the people. " ing.

The toolkit is accumulated to accumulate data on COVID-19 from a reliable source, and formatify it with tools such as "Pandas" or "Scikit-Learn". The notebooks ("Codait/Covid-Notebooks") released this time utilize data from some important and prestigious sources, and for US counties, the system at Johns Hopkins University. It uses data from the "COVID-19 Data Repository" ("CSSEGISANDDATA/COVID-19") operated by the Science and Engineering Center (CSSE). This toolkit is the "Coronavirus (COVID-19) Data In The United States" repository ("NYTIMES/COVID-19-Data") and New York newspapers THE CITY by New York THE CITY. The summary of the data ("NYCHEALTH/CORONAVIRUS-Data") ("THECITYNY/COVID-19-NYC-DATA") is also used. For other countries, geographical distribution data shows the COVID-19 infection status in the world, which is announced by the European Disease Prevention Management Center (ECDC).
Since the data is updated daily, it is downloaded every time this notebook is executed.Redistributing datasets by a profitable organization is prohibited in the license clause.
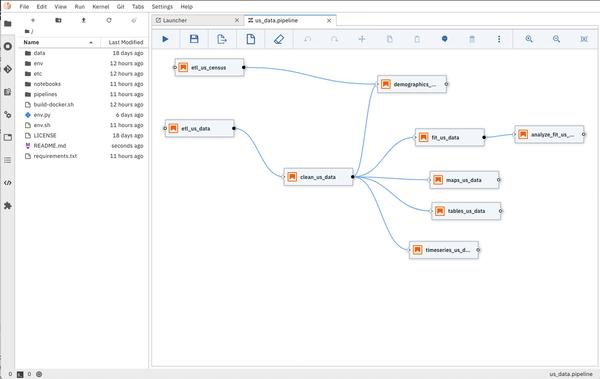
IBM created a data processing pipeline for the purpose of supporting users to keep the information on this notebook up to date.For example, this allows users to build a pipeline of time series at the County Level in the United States.Each box represents a Jupyter notebook.Users can store a set of notebooks in the cloud by clicking the arrow of the toolbar at the top of the workflow.This pipeline uses "Kubeflow Pipelines".
REISS says, "It's important to point out that the basic data of COVID-19 is changing every day. Users want to update their own notebooks many times as they are working on their own analysis.You should think. "
This article edited an article from overseas CBS Interactive by Asahi Interactive for Japan.