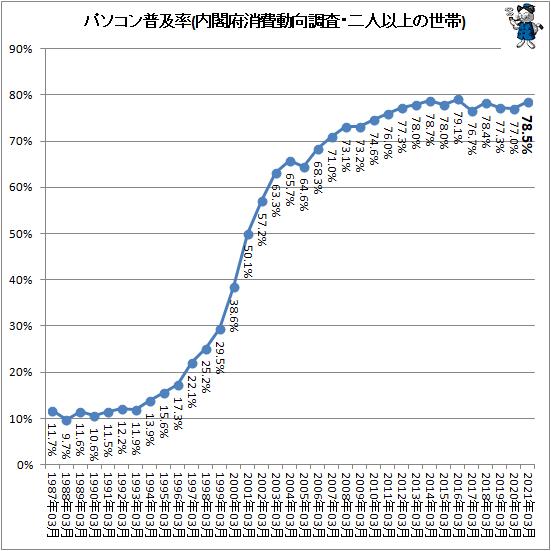
Recently, it has been pointed out that people are moving away from personal computers due to the spread of smartphones. Have computers been in the home for a long time? We will confirm the long-term changes in the penetration rate of PCs based on the results of the Consumer Confidence Survey (*) conducted by the Cabinet Office.
The following shows the long-term changes in the penetration rate of personal computers in two-or-more-person households. Since the target of the long-term survey is only two-or-more-person households, this value is used to confirm the current state of personal computer penetration. It should be noted that this value is the penetration rate of the personal computer itself (of course, including the peripheral devices necessary for use such as displays), not the penetration rate of computers that are connected to or can access the Internet. Also, there is no classification of desktop computers and notebook computers.
Of course, there is no doubt that almost all computer users are Internet users nowadays. On the other hand, on the other hand, mobile phones and home-use game consoles are now fully connected to the Internet, so the PC usage rate does not equal the Internet usage rate. It is also necessary to keep in mind that
The personal computer penetration rate began to rise rapidly in the latter half of the 1990s, but the momentum plateaued at 65.7% in 2004. After that, it showed a rise again, but the rate of increase slowed down around 70%.
Also, in the past few years, the number of cars owned per household has remained flat, and there has been a gradual decline. It is presumed that this is due to the increasing number of households that do not or do not need to install multiple computers due to the spread of smartphones and tablet devices. For example, in an environment where computers were once required for mothers and children as well as fathers, now only fathers use computers, and children and mothers use tablets and smartphones for Internet-related use. .
A computer with a keyboard is indispensable for various practical tasks such as writing documents, but if you just want to access websites and use apps, smartphones and tablet devices can be a good substitute. Furthermore, some tablet-type terminals have a mechanism such as attaching a keyboard, and demonstrate the same performance as a notebook computer. Recently, we often see and hear talk about the shift away from keyboards and computers, especially among young people, and it seems that this trend has begun to be reflected in consumer surveys.
However, as of 2020, although it is limited to households of two or more, it is also true that nearly four out of five households have a computer at home.
■Related articles:
How long does it take to replace a computer?

Smartphones stretch and PCs fall…Exploring the actual situation of digital device usage among elementary school students and high school students
*Cabinet Office consumer trends survey
The purpose is to obtain basic data for judging economic trends by grasping consumer awareness of future living prospects, spending schedules for various services, and holding status of major durable consumer goods. A survey that says. The surveyed households consist of 8,400 households selected by three-stage sampling (municipalities, survey unit districts, and households) for households of two or more persons and single-person households. The survey is conducted once a month on the 15th of each month. The survey forms are mailed to the surveyed households around the 10th of each month, and the survey forms received by around the 20th of each month are counted.
We conduct monthly surveys, but once a year, in March, we survey more detailed content than in other months. One of the items in the survey, "Diffusion and ownership of major durable consumer goods," is used in this investigation. This is the result of asking ``Whether or not the respondent's household has the target item at the time of answering (as of the end of March 2020 in the case of the most recent minute)'' and ``If so, what is the quantity held?''. I didn't ask about specific usage.
(Note) Unless otherwise specified, the graphs and charts in the text are quoted from or created by the author based on the materials.
(Note) Unless otherwise noted, the photographs in the text were created by the author based on the materials described in the text, or were taken by the author during interviews.
(Note) Numbers used in article titles, text, graphs, etc. may be written after rounding off any digits after the decimal point so that the display is considered optimal on the spot. I have. Therefore, the total number of figures on the display may not match exactly.
(Note) If the value at the end of the axis of the graph is set to a non-zero positive value in order to fix the appearance of the graph or make it easier to see the movement of the numbers, the value is enclosed in a circle or the like to call attention to it. There are cases.
(Note) In order to improve the appearance of the graph, the notation of items (such as okurigana) may be partially omitted or changed.
(Note) "ppt" in the graph means % points.
(Note) "(Great) Earthquake" refers to the Great East Japan Earthquake unless otherwise specified.
(Note) This article is a partial addition and change to the article published in [Garbage News].